

Five Goal Free Ball:
The PITTSBURGH Penguins Partnership THAT SKYROCKETED A RESTAURANT BRAND AND BECAME A GAMEDAY STAPLE
How an in-game trigger impacted restaurant revenue lift, brand affinity, and social momentum
THE CHALLENGE
Align ourselves with the winning brand of our pro sports partner in a way that simultaneously raises our own brand awareness, drives foot traffic, and increases check averages, check counts, and total revenue.
CONSIDERATIONS
Crowded advertising environment
Association with positive in-game moments
Complemented the ‘quirkiness’ of the meatball-centric restaurant
Risk of over-frequency vs under-frequency
Multiple touchpoints - Social Media, In-Arena, Retail Marketing
BUILDING THE ‘FIVE GOAL FREE BALL’ ACTIVATION
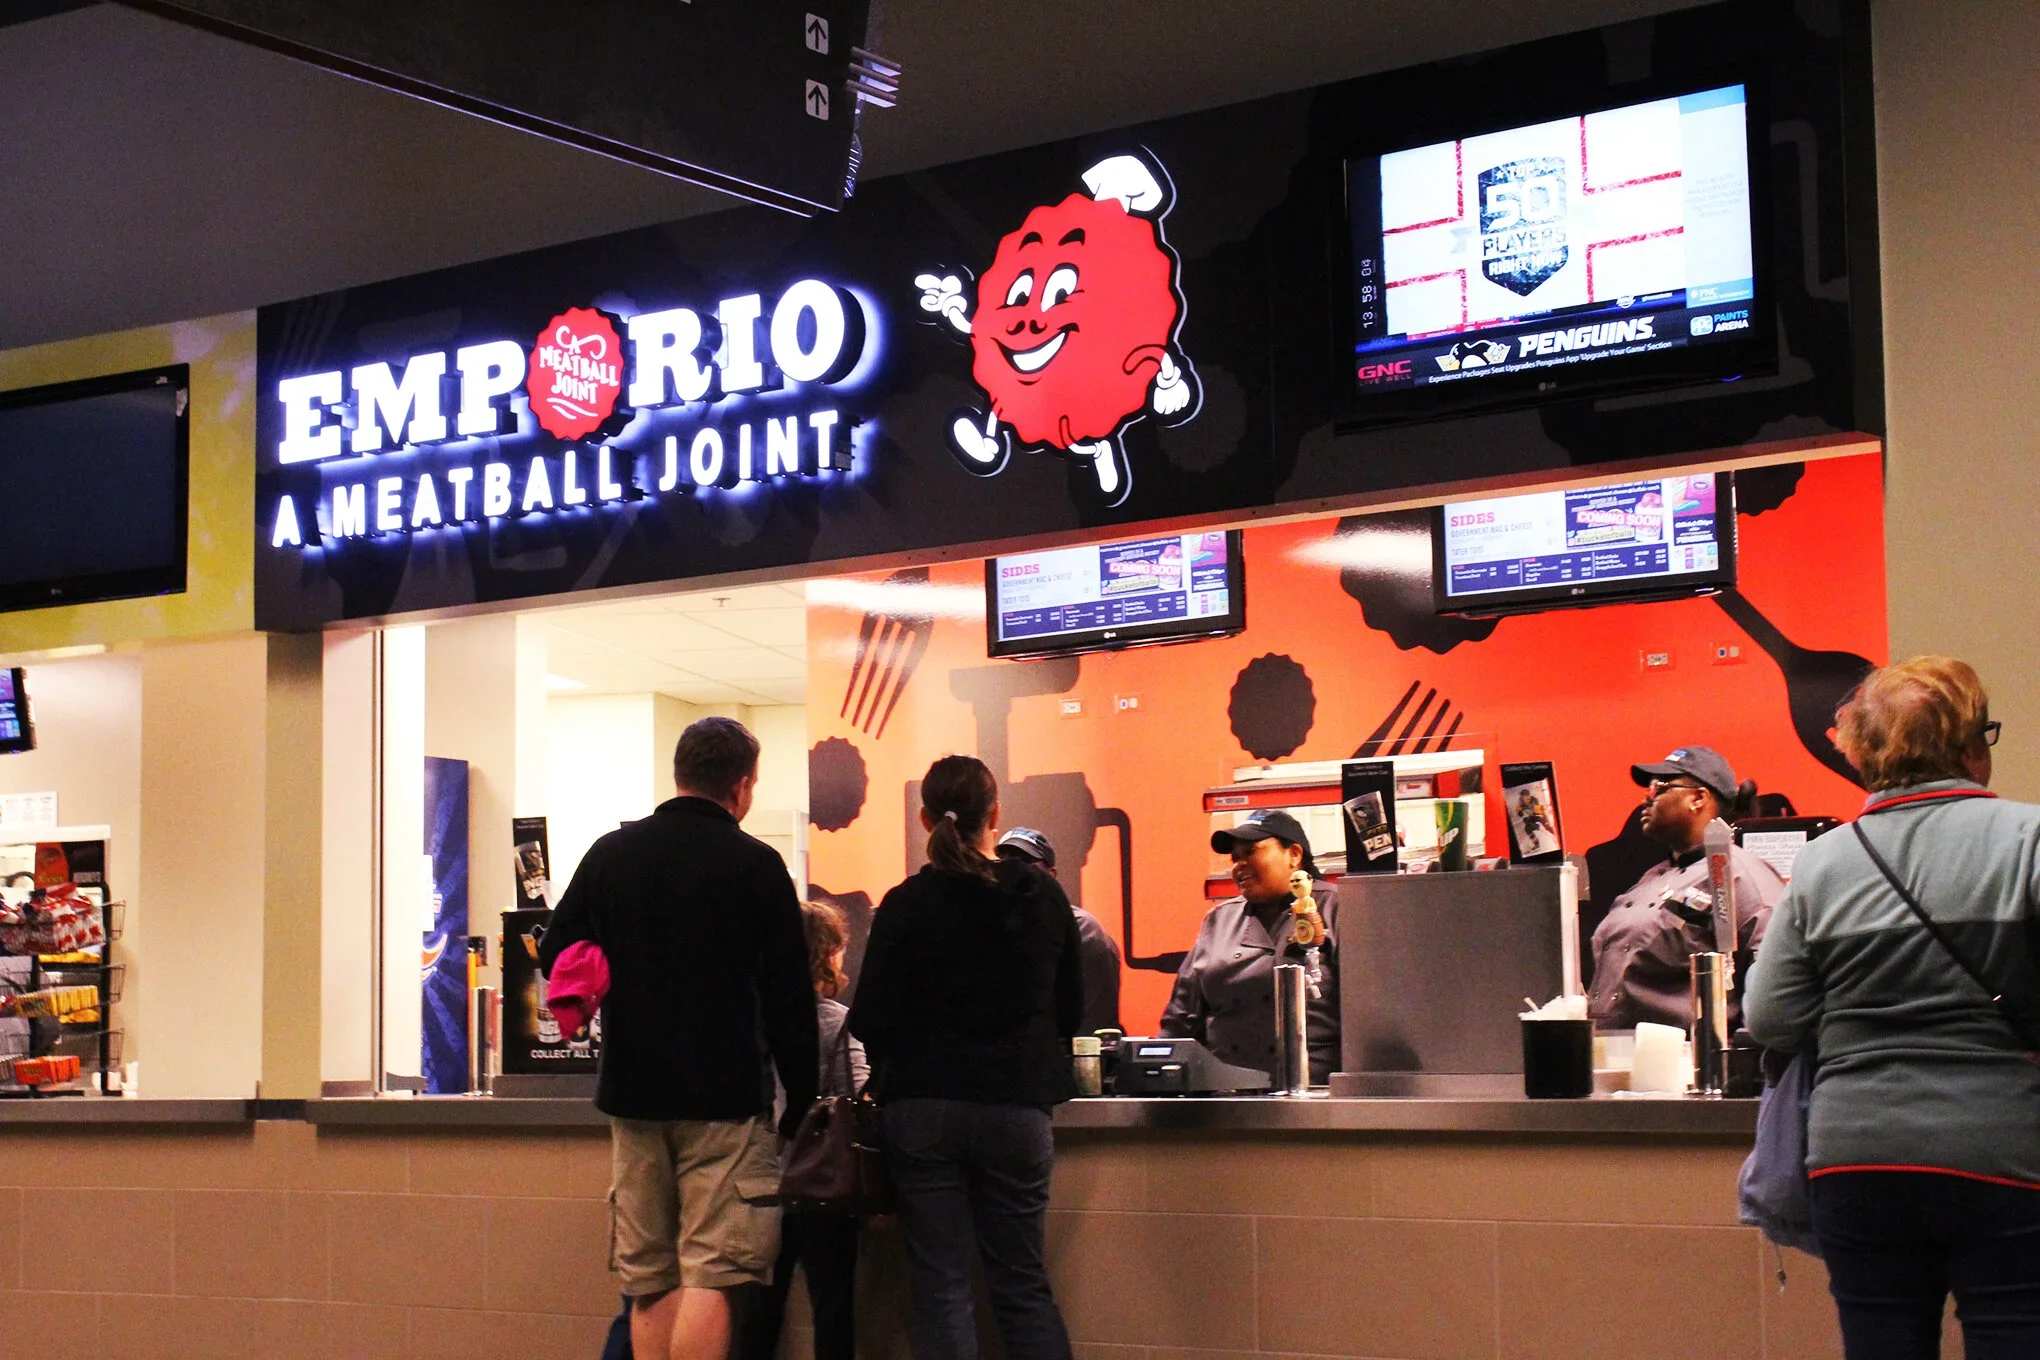
Emporio: A Meatball Joint is a meatball-centric restaurant located in Downtown Pittsburgh. The location serves as a pre-game, post-game, and popular lunch/dinner spot within walking distance to PPG Paints Arena - home of the Penguins. We saw an opportunity to align with the Pittsburgh Penguins to build our brand.
THE CONCEPT
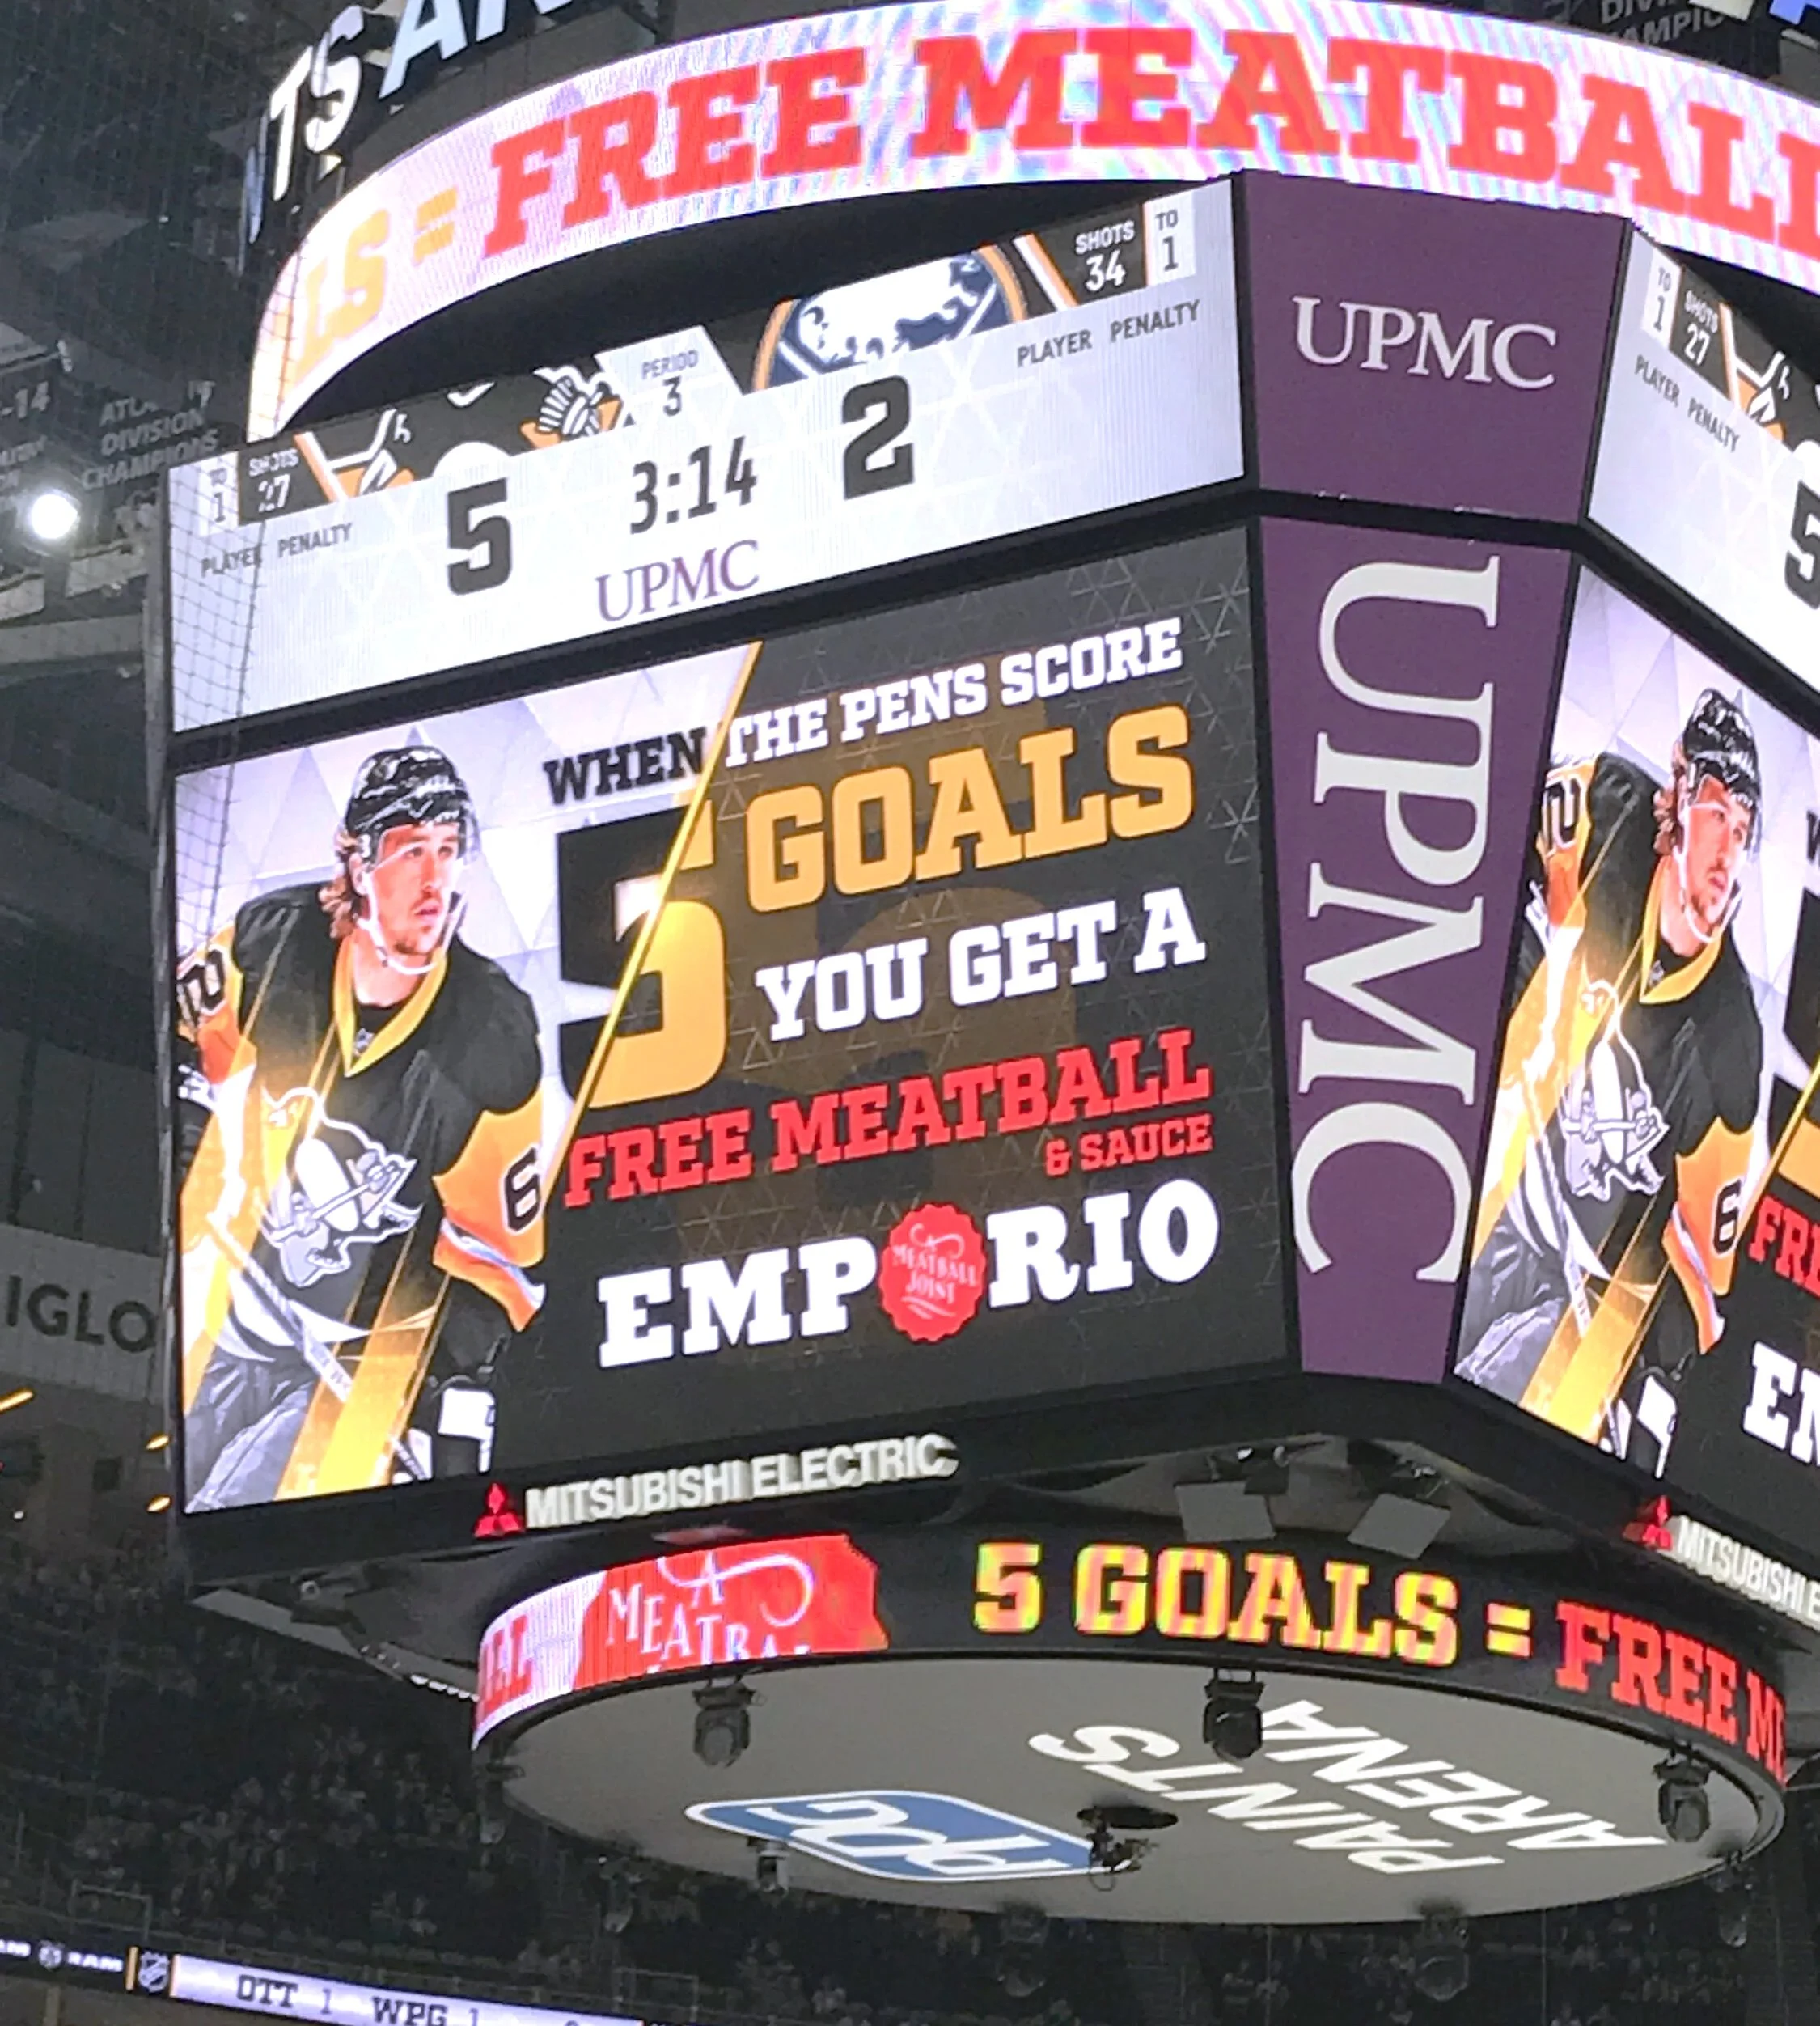
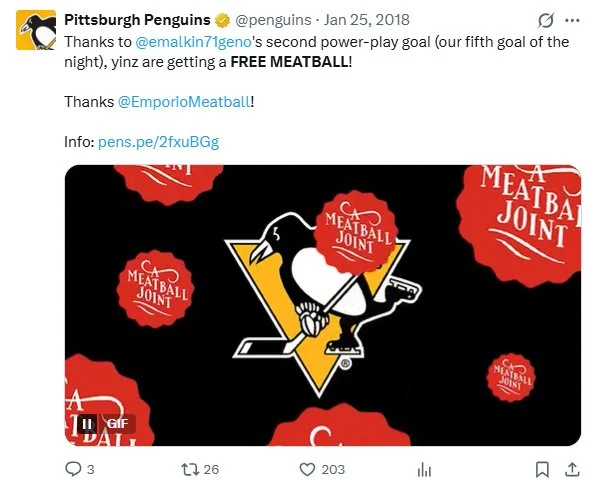
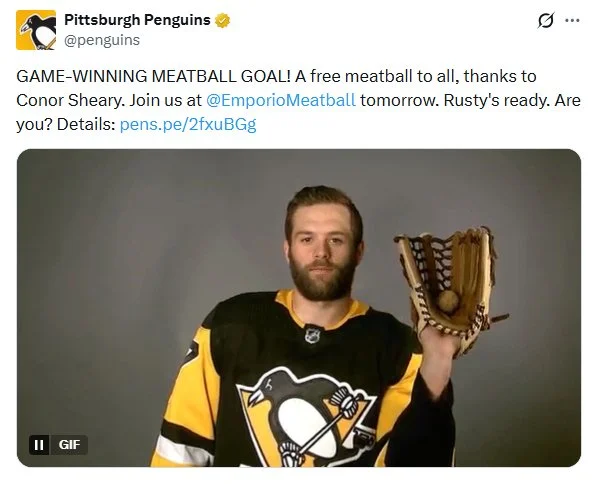
When the Penguins scored 5 goals in a game, all fans would recieve a ‘Free Meatball’ at our Downtown or Wexford location the day after the game.
The trigger would be announced in-arena to the sellout crowd in attendence as well as to the 1M+ followers on the Penguins Twitter account.

Co-branded logo designed for partnership. Partnership included ‘Official Meatball’ designation
WHY 5 GOALS?
We designed this activation to integrate naturally into the game-day experience, associating the brand with positive, high-engagement moments during play.
Frequency was carefully calibrated to strike a balance between impact and novelty; appearing often enough to build recognition, but not so often that the experience became repetitive or lost its effectiveness.
Using SQL, I ran a query based on final scores and Goals For from the previous 5 regular seasons. We compared frequency of 3/4/5/6+ goal games.
SELECT
    season,
    COUNT(*) AS total_games,

    COUNT(*) FILTER (WHERE goals_for >= 3) AS games_3_plus,
    ROUND(
        COUNT(*) FILTER (WHERE goals_for >= 3)::numeric
        / COUNT(*) * 100,
        2
    ) AS pct_3_plus,

    COUNT(*) FILTER (WHERE goals_for >= 4) AS games_4_plus,
    ROUND(
        COUNT(*) FILTER (WHERE goals_for >= 4)::numeric
        / COUNT(*) * 100,
        2
    ) AS pct_4_plus,

    COUNT(*) FILTER (WHERE goals_for >= 5) AS games_5_plus,
    ROUND(
        COUNT(*) FILTER (WHERE goals_for >= 5)::numeric
        / COUNT(*) * 100,
        2
    ) AS pct_5_plus,

	    COUNT(*) FILTER (WHERE goals_for >= 6) AS games_6_plus,
    ROUND(
        COUNT(*) FILTER (WHERE goals_for >= 6)::numeric
        / COUNT(*) * 100,
        2
    ) AS pct_6_plus

FROM records
WHERE season IN ('2009-10','2010-11','2011-12','2012-13','2013-14')
AND game_type = 'Regular'
GROUP BY season
ORDER BY season;
Goal Frequency Breakdown
3 Goal Games
| Season | games_3_plus | pct_3_plus |
|---|---|---|
| 2009-10 | 53 | 64.63 |
| 2010-11 | 46 | 56.1 |
| 2011-12 | 54 | 65.85 |
| 2012-13 | 31 | 64.58 |
| 2013-14 | 56 | 68.29 |
| 3+ Goal Avg | 63.89 | |
| 4+ Goals Games | ||
| Season | games_4_plus | pct_4_plus |
| 2009-10 | 30 | 36.59 |
| 2010-11 | 27 | 32.93 |
| 2011-12 | 39 | 47.56 |
| 2012-13 | 21 | 43.75 |
| 2013-14 | 33 | 40.24 |
| 4+ Goal Avg | 40.21 | |
| 5+ Goals Games | ||
| season | games_5_plus | pct_5_plus |
| 2009-10 | 18 | 21.95 |
| 2010-11 | 17 | 20.73 |
| 2011-12 | 22 | 26.83 |
| 2012-13 | 14 | 29.17 |
| 2013-14 | 15 | 18.29 |
| 5+ Goal Avg | 23.39 | |
| 6+ Goals Games | ||
| season | games_6_plus | pct_6_plus |
| 2009-10 | 9 | 10.98 |
| 2010-11 | 5 | 6.1 |
| 2011-12 | 9 | 10.98 |
| 2012-13 | 7 | 14.58 |
| 2013-14 | 3 | 3.66 |
| 6+ Goal Avg | 9.26 |
5 Goal Games occured 23.39% of the time. Close to 1 out of 4 games.
We believed this was the optimum frequency to keep the activation novel and impactful.
TRACKING AND MEASURING IMPACT
How did the campaign affect check count and check averages?
Establish Parameters
We defined attribution window from this activation to sales the day after an activation was triggered. The activation usually occurred during post-dinner hours so we assumed the peak redemption time as the following day during lunch and dinner service. Beyond 24 hours, it was unclear if we could attribute the redemption directly to the most recent activation and these were excluded.
Establish Baseline
Prior to launch, we established a baseline for average check value and checks per day to represent typical demand. We used prior-year sales data specifically focusing on ‘day-after-game’ sales and check counts. Weekends vs weekdays, one-off events, and holidays were factored in when creating this baseline by adjusting or excluding when necessary.
Track Redemptions
We created a dedicated item number and POS button to track redemptions. This way ‘Five Goal Free Balls’ were separated from standard single-ball purchases. To redeem the offer, guests were required to reference the activation or present the promotional tweet from either our account or the official pro team account. Limit one per guest.
Run POS Reports
Daily Sales Summary + Check Detail (This Year) - Total check count, check totals, and revenue for all day-after-activation days.
Daily Sales Summary + Check Detail (Previous Year) - Our baseline that mirrors the current-year sales report
Activation Report: Day-after-game checks that included the dedicated ‘Five-Goal-Free-Ball’ Item, isolating direct promotional response.
Calculate Incremental Lift & Direct Response
Example Formulas
Check Count Lift (%)
(Impact Year Check Count − Baseline Check Count) ÷ Baseline Check Count × 100Check Avg Lift (%)
(Impact Year Avg Check − Baseline Avg Check) ÷ Baseline Avg Check × 100Direct Responses
Total Check Counts - Activation Check Count
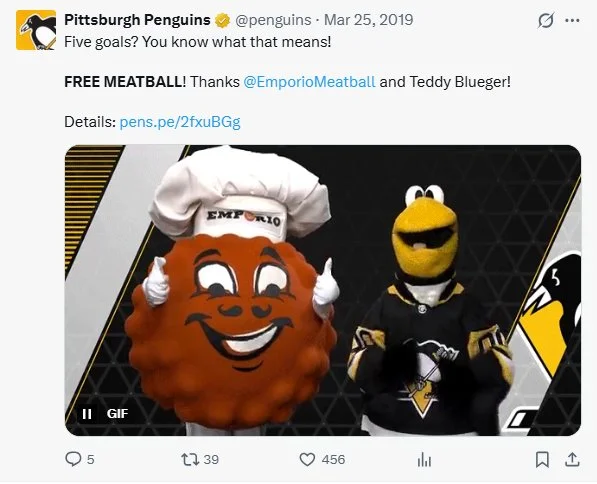
AMPLIFIED BY @PENGUINS
One of the top Twitter accounts in the NHL with 1M+ followers, I collaborated with the social media team to create co-branded creatives to keep the activation fresh.
BRAND AWARENESS RESULTS
15
IN-ARENA IMPRESSIONS
Using our SQL database, we are able to calculate the sum of attendance per home game where a 5-goal game occurred.
1000000
SOCIAL IMPRESSIONS
This metric represents the cumulative sum of tweet impressions across the three-year campaign. On average, each Five Goal Free Ball tweet generated approximately 60,000 impressions, driven primarily by organic fan sharing and engagement.
1%
WEB TRAFFIC LIFT
Within 24 hours of a five-goal game, Emporio’s website experienced a 66% lift in sessions versus expected baseline traffic.
BUSINESS IMPACT
+ 1%
AVERAGE COVERS
Percent increase in check counts on days AFTER the Penguins scored 5 goals.
+ 1 %
NEXT DAY REVENUE LIFT
Percent change in the average revenue on days AFTER the Penguins scored 5 goals.
+ 1%
WEEKEND REVENUE LIFT
Percent change in the average revenue WEEKENDS AFTER the Penguins scored 5 goals.
RESULT VISUALS
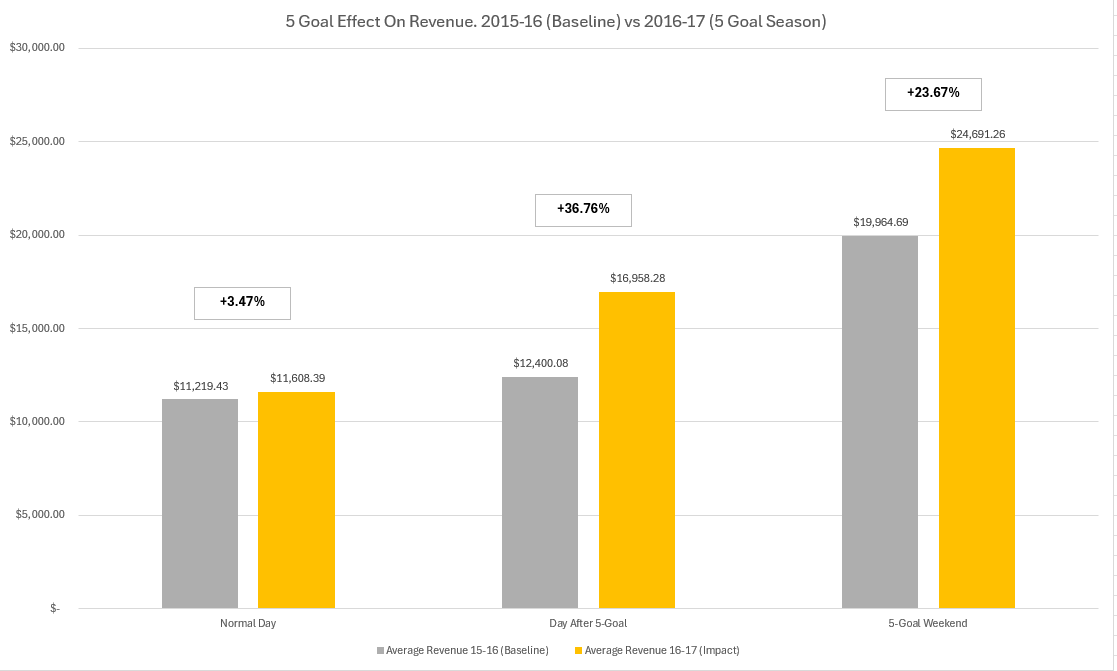
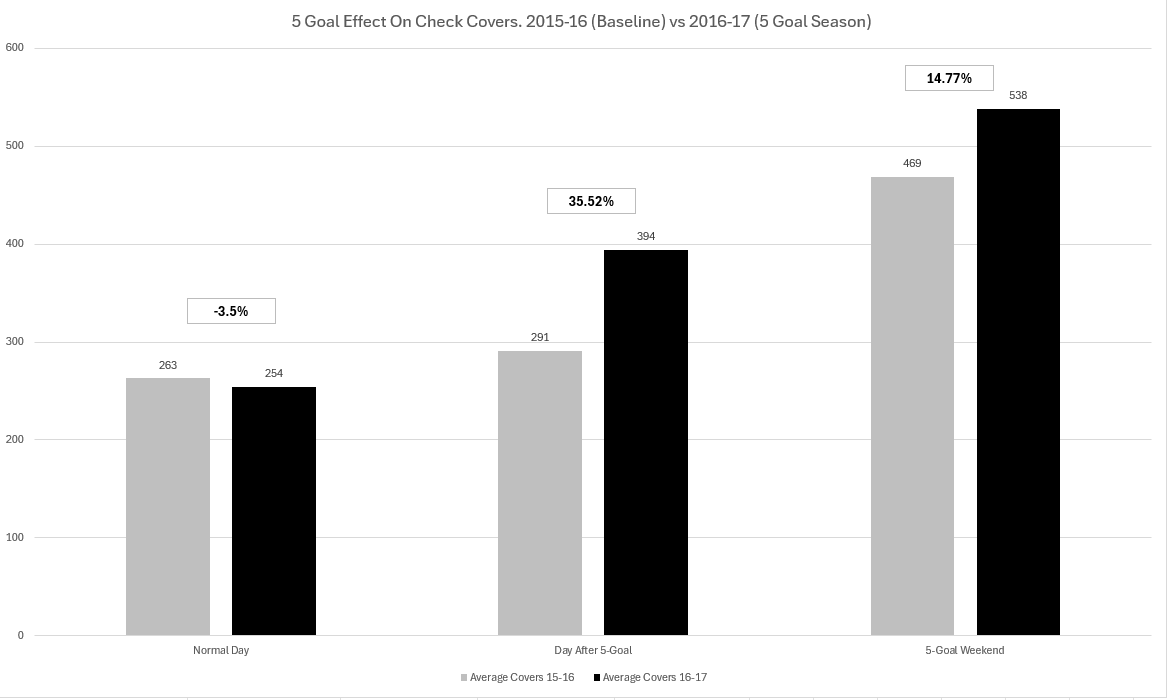
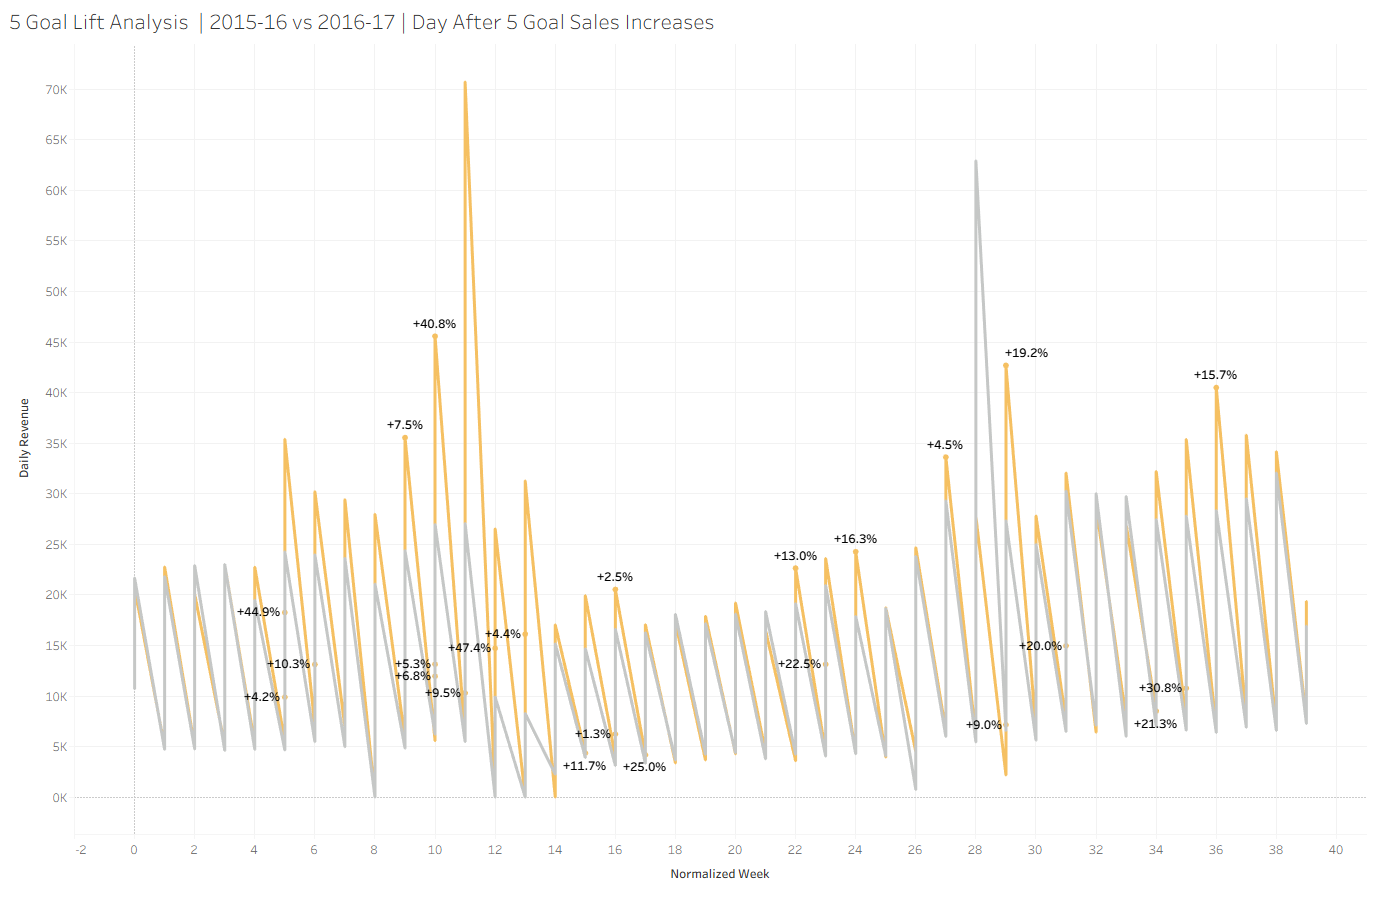
This Tableau visualization is comparing the 2015-16 (Baseline) season to the 2016-17 (Impact) season. The day after a 5-goal game occurred is labeled with the lift percentage. For comparison purposes, weeks have been normalized so days of the week are aligned (Saturday to Saturday, etc). This is better than matching to specific day because a low revenue Monday in the baseline might be a high revenue Friday in the treatment year, leading to more noise.
KEY TAKEAWAY
The five-goal cadence proved to be the optimal frequency for the activation, balancing rarity with relevance to keep the brand top-of-mind throughout the season.
Overall we found very positive effects on revenue.
For the DAY AFTER a 5 goal game, there was a 36% lift in revenue and a 35% lift in covers.
For the WEEKEND FOLLOWING a 5 goal game, A 23.67% LIFT in revenue AND A 15% in covers.
We felt confident that causality could be applied to the Five Goal Free Ball because non-game days had an average of +3.5% growth in revenue and even a -3.5% drop in covers. A t-test confirmed that these results had a less than 5% chance of being random.
The campaign drove meaningful increases in foot traffic, average check value, total quantity of checks, and total revenue while delivering a unique, shareable experience across multiple touchpoints — in the arena, at home watching on TV, on social media, and in the restaurant — reinforcing both brand awareness and customer engagement.
TOOLS USED FOR THIS CASE STUDY
SQL: Window Functions, CTE, Joins, Date Truncation
Python: Synthetic Dataset Creations
Tableau: Table Calculations (LOOKUP, ZN) Dual-Axis Charts, Data Normalization
Statistics: Control vs. Treatment Groups, T-Tests, Normalization
Excel
Social Media Analytics
GA4 - Google Analytics
Business Financial Reports