

From Scratch to System
Building a B2B2C Funnel in 90 Days
How I set up the funnel framework, applied weighted marketing metrics to revenue, and testing lag effects to optimize timing and performance
THE CHALLENGE
With disconnected systems and peak season upcoming, I had 3 months to form a framework to connect marketing spends and efforts to sales, revenue, and ROI.
The promotional products industry operates on a three-tier model: supplier, distributor, and end user. As a supplier-side marketer, this structure creates inherent challenges; marketing efforts must enable distributors to sell effectively while offering limited visibility into end-user behavior.
In this case study, I explored how aggregated, channel-weighted marketing data drives downstream orders and revenue outcomes.
CONSIDERATIONS
Weighted Channels: Create weighted indices to make better comparisons between channels and funnel stages
Lag Analysis: Marketing impact does not occur instantaneously. To identify when marketing effects translates into orders, we test multiple lag structures
Taking Funnel Control: Introduce better indicators of Consideration and Intent to enhance our funnel
Guiding Decisions: Model should enable scenario planning and aid in forecasting future behavior

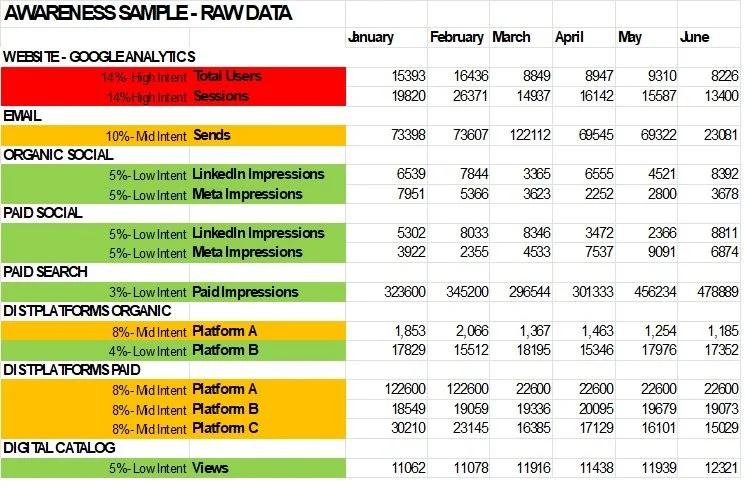
DATA SOURCES & STRUCTURE
This analysis focused on Awareness and Consideration data. Data was channel-aggregated monthly then weighted to create normalized and comparable indices. Weights were created based upon historical data as well as indicators of brand proximity or intent, such as an organic social follower or email subscriber. Data sources: Google Analytics, Google Ads, Hubspot, Meta Ads, LinkedIn Ads, Industry Dashboards
AWARENESS CHANNEL (WEIGHT%)
Website
Total Users (14%)
Total Sessions (14%)
Email
Sends (10%)
Organic Social
LinkedIn (5%)
Meta (5%)
Paid Social
LinkedIn (4%)
Meta (4%)
Paid Search
Paid Impressions (3%)
Industry Platforms (Organic)
Platform A Impressions (8%)
Platform B Impressions (4%)
Industry Platforms (Paid)
Platform A Impressions (8%)
Platform B Impressions (8%)
Platform C Impressions (8%)
Digital Catalog
Catalog Views (5%)
CONSIDErATION CHANNEL (WEIGHT%)
Website
Form Submits (33%) - see Data-Driven Web Rebrand
Email
Opens (5%)
Clicks (8%)
Organic Social
LinkedIn Engagement (3%)
Meta Engagement (3%)
Paid Social
LinkedIn Engagement (2%)
Meta Engagement (2%)
Paid Search
Paid Clicks (1%)
Industry Platforms (Organic)
Platform A Engagement (14%)
Platform B Engagement (7%)
Industry Platforms (Paid)
Platform A Engagement (7%)
Platform B Engagement (7%)
Platform C Engagement (5%)
Digital Catalog
Catalog QR Scans (3%)
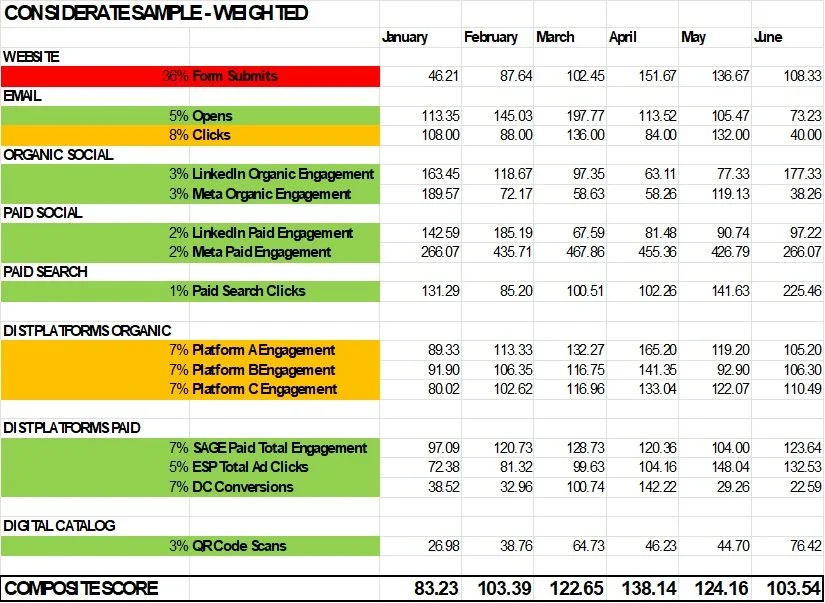
All channel weights were normalized to a 0–100 composite score.
This enabled straightforward comparison across channels and against historical averages.
FUNNEL ANALYSIS
Using the normalized Awareness and Consideration data as well as Orders and Revenue, I calculated key funnel efficiency ratios to pinpoint where potential drop-offs or bottlenecks occur:
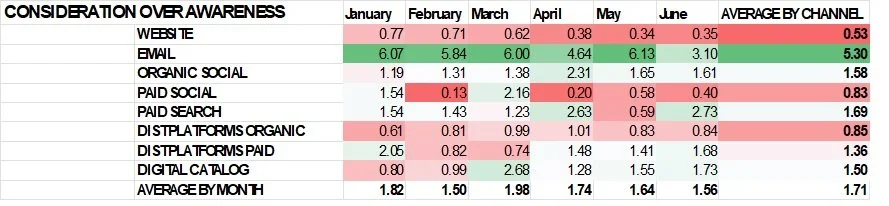
CONSIDERATION PER AWARENESS
We calculated Conversion / Awareness to get an idea of what channels are performing from one stage of the funnel to the next. In the example below, e-mail is performing exceptionally well, while total users and sessions to form submits is performing below expectations.
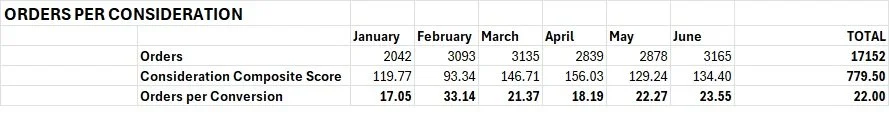
ORDERS PER CONSIDERATION
Orders per Consideration Composite Score was used as a efficiency ratio to see how consideration activity aligned with downstream order volume. This ratio does not serve as an attribution model but rather directional insight to how conversion signals may relate to order volume.
REVENUE PER ORDER
I tracked Revenue Per Order as a baseline ratio to not only helps evaluate whether marketing efforts are driving not just more orders, but more valuable ones. This metric also aided in budgeting and forecasting. Proprietary data is used to calculate this ratio and no example is provided.

CREATIVE OPTIMIZATION
REBUILDING A PRODUCT PHOTO LIBRARY
We replaced inconsistent lifestyle imagery with a cohesive library of high-resolution, product-focused visuals. By emphasizing clarity, texture, and detail, we created assets optimized for both paid media and web. This shift improved ad engagement, strengthened brand consistency, and streamlined the path from click to conversion.

Lifestyle photography at best leads to an inconsistent look and adds unnecessary noise to the buying decision. At worst, it can invite bias and discrimination.
The new photo library conveyed more and better decision information such as size, color, and imprinting options. Consistent sizing, resolution, and file formats also allowed for extended implementation across channels.
LAG ANALYSIS
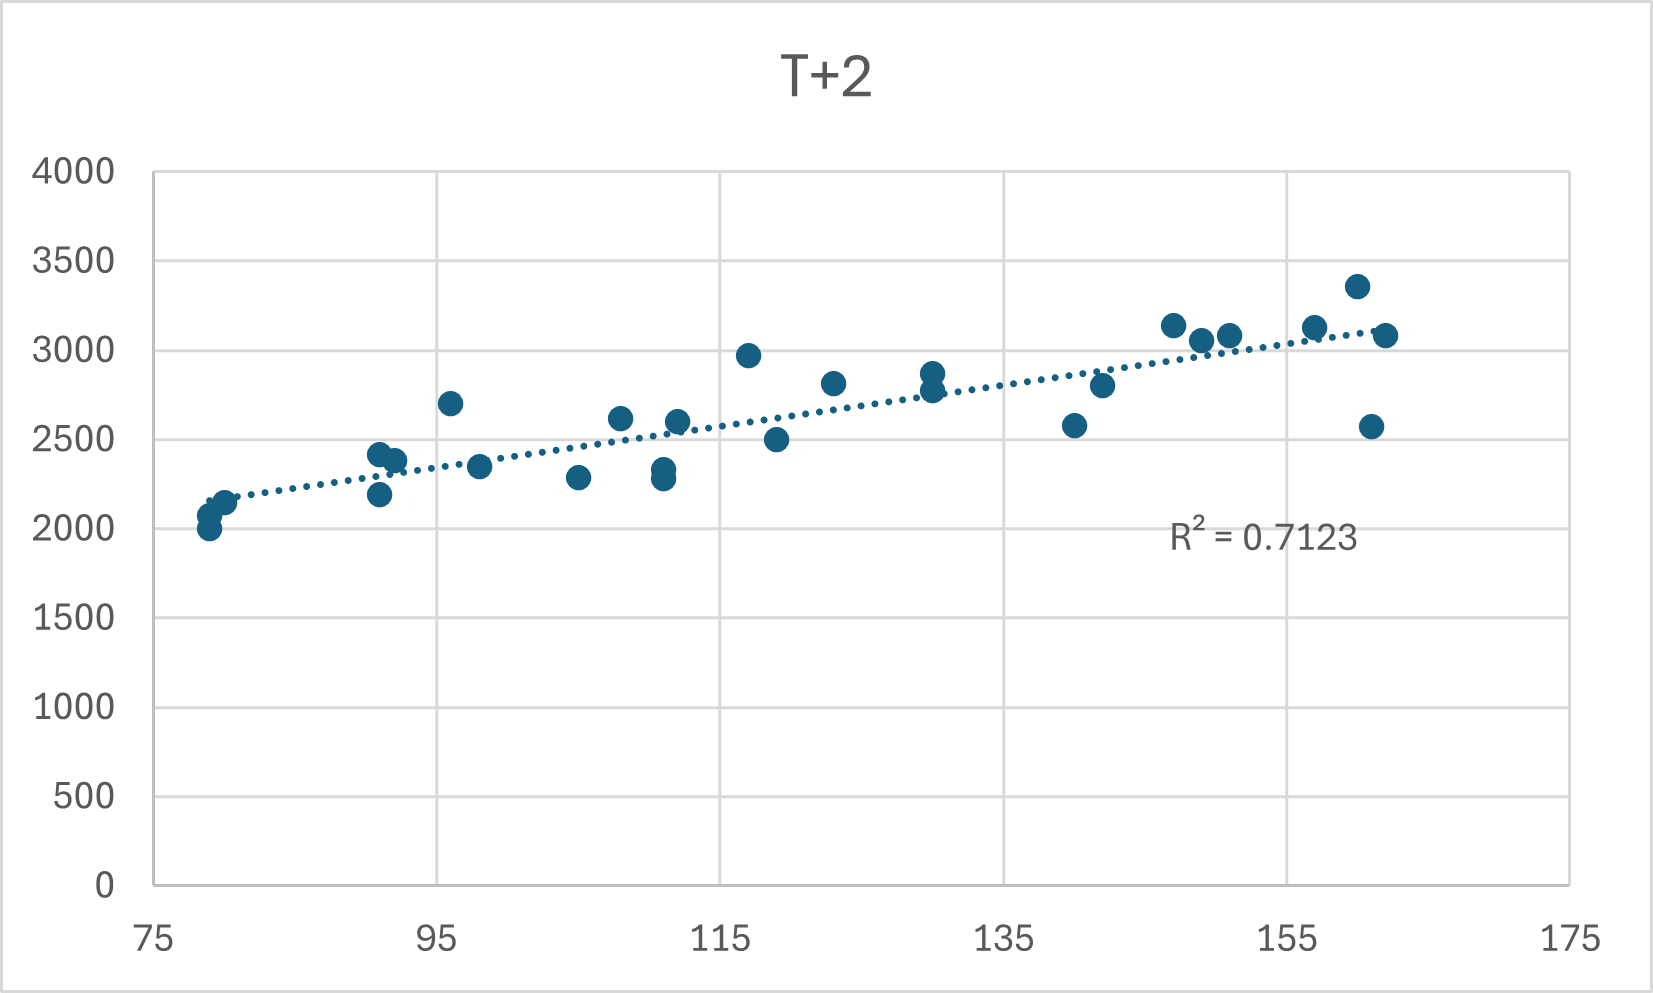
What Sales Cycle Lag Best Reflects the Supplier–Distributor–End User Relationship?
I tested a lag effect on how Consideration Composite Score correlated to Orders. Orders are the dependent variable and Consideration Composite Score is the independent variable in the graphs below.
Monthly data (n = 36); orders evaluated at t+0 to t+3 months. Composite consideration score normalized across mid-funnel behaviors. Analysis used to understand timing, not infer causality.
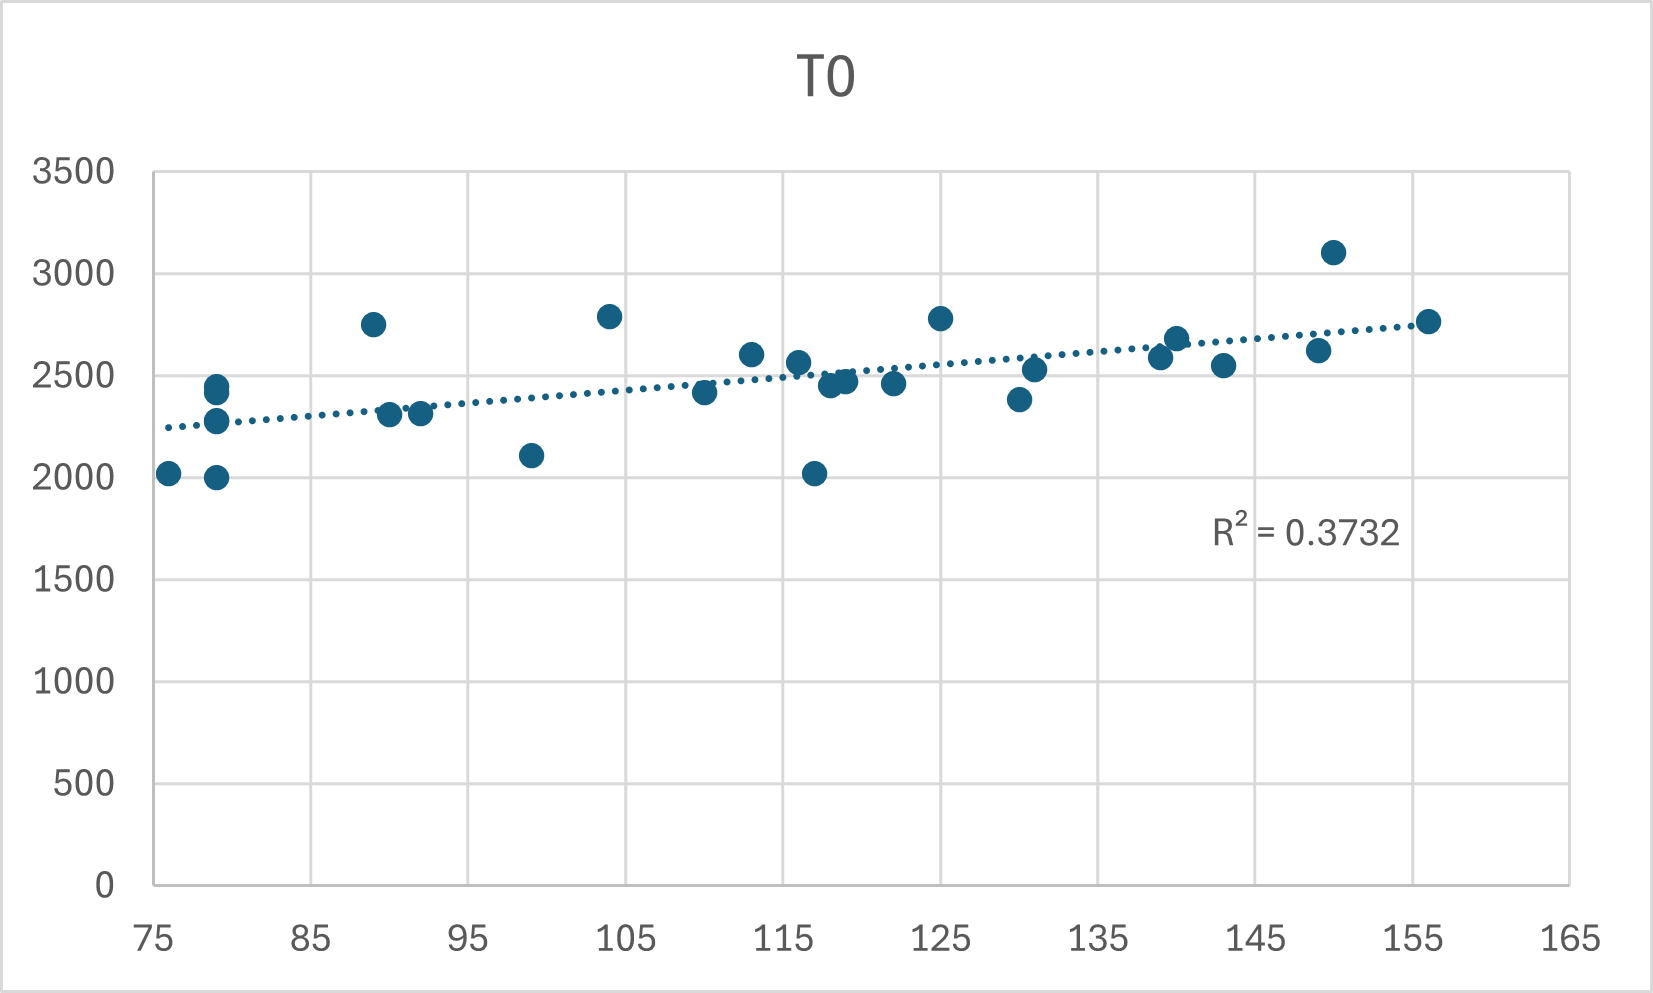
T0 (Same Month)
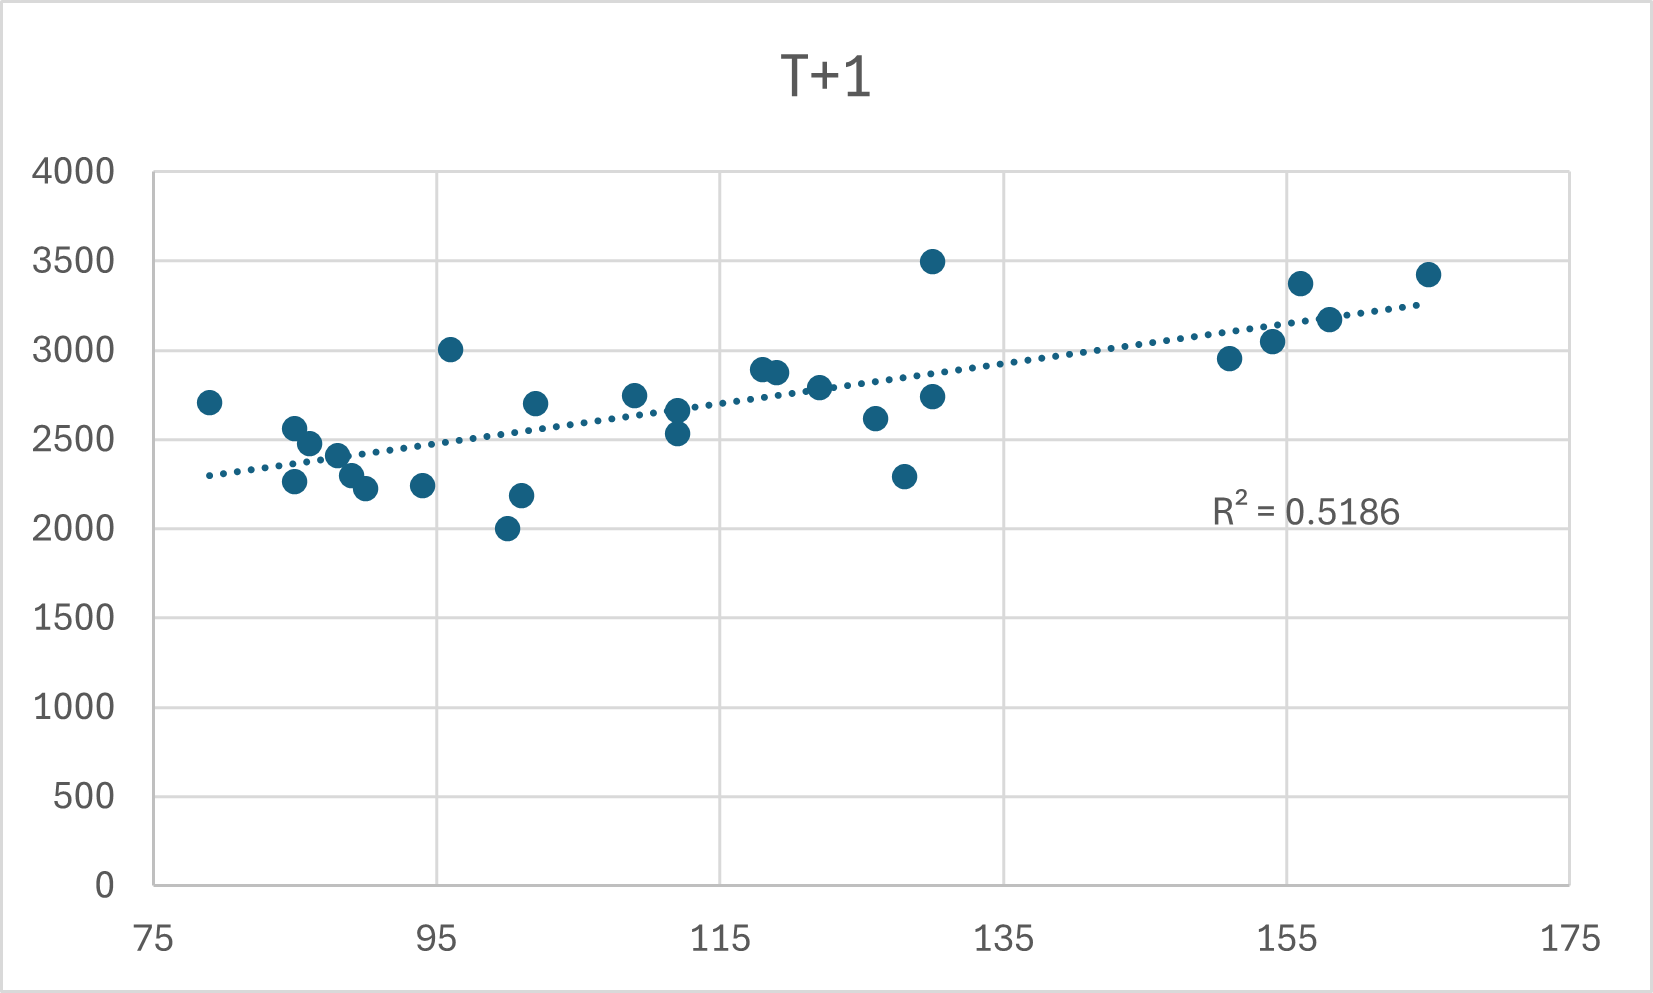
T+1 (Add 1 Month Lag)
T+2 (Add 2 Month Lag)
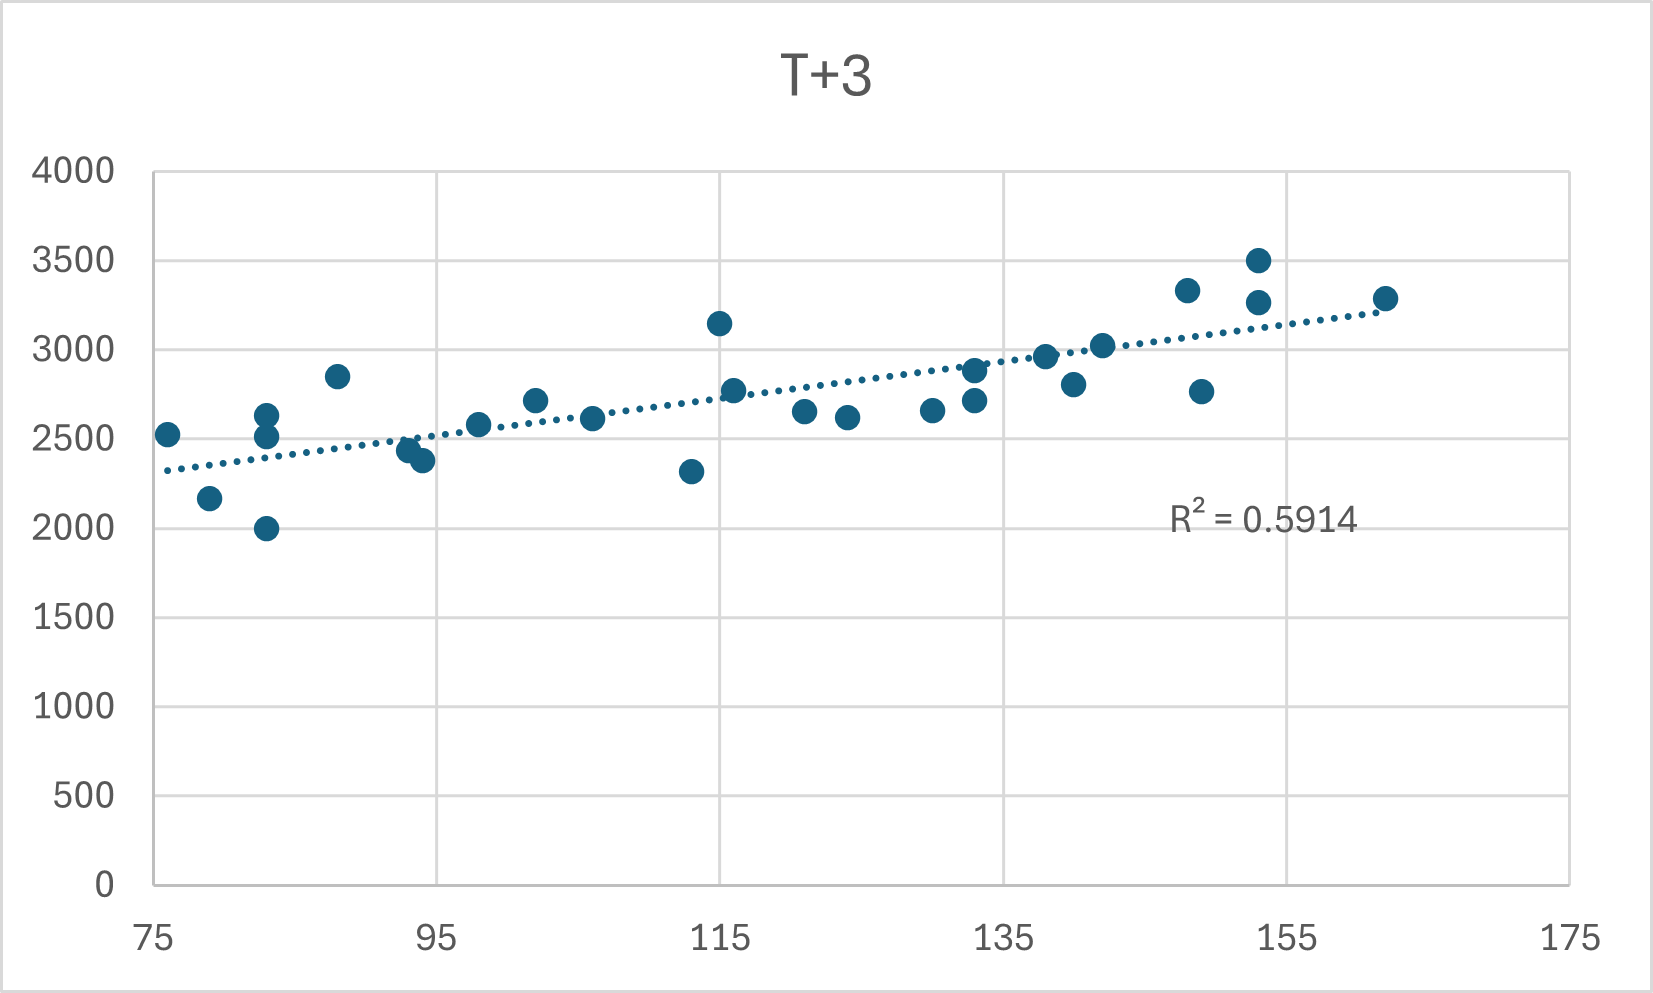
T+3 (Add 3 Month Lag
PEAK CORRELATION: 2 MONTHS
Consideration Performance explains 71% of Order variance two months later. This aligns with real-world timing. Distributors respond after the end user’s decision and process the order back to the supplier.
DATA-DRIVEN WEBSITE REBRAND
To better understand how potential customers move through our sales funnel, we reimagined our website with a data-first approach. The goal was to capture more meaningful signals of consideration while streamlining the sales process for distributors and end-users.
ADD REALTIME PRODUCT INVENTORY
A key part of the sales cycle was distributors checking for inventory available before making a sale pitch. This used to require calling our customer service team who would look up each request individually.
Connecting our ERP system to our website allowed current inventory for each product and its variants to display directly on the website.
DIRECT QUOTE & ORDER SUBMISSION
Customers can now submit a quote or order directly through the website.
This not only simplifies the customer experience but also prevents lost opportunities from phone calls or back-and-forth emails.
REQUIRE LOGIN FOR ACCESS TO KEY NEW FEATURES
Previously, website traffic was mostly anonymous. By requiring users to log in to view live inventory or to submit quotes, we created a strong behavioral signal of intent.
Login activity became a proxy for consideration, allowing us to track which users are actively evaluating products.
INTEGRATE WITH HUBSPOT FOR ENHANCED CUSTOMER INSIGHTS
Login and activity data are now sent to HubSpot, linked to individual customer profiles.
This provides the sales team with better visibility into customer intent and engagement, enabling more targeted follow-ups and personalized service.
THE RESULT
Increased the accuracy of our Consideration metric by capturing meaningful user behaviors rather than relying solely on generic traffic or worse, phone calls and emails, which were highly inaccurate.
Reduced Quote Loss and improved sales efficiency by timestamping, digitizing, and centralizing submissions
Gave us an actionable marketing goal to increase traffic to website and encourage logins and online quoting
Strengthened sales and marketing alignment by adding web activity after login as valuable sales insights
KEY TAKEAWAY
Consideration efficiency matters most: Consideration-to-orders ratio was the strongest predictor of revenue.
Lag timing is critical: Awareness drives orders most strongly after one month; campaigns should be timed accordingly. We found 2-month lag to be optimal.
Stage-specific focus: Low Consideration/Awareness ratios indicate messaging or targeting improvements; low Orders/Consideration ratios indicate conversion friction.
Revenue levers: Order volume drives revenue more than average order value in this dataset, indicating promotional focus should target conversion rather than upsell.
TOOLS USED FOR THIS CASE STUDY
HUBSPOT
TABLEAU
GA4
META ADS
LINKEDIN ADS
GOOGLE ADS
EXCEL
IN-STORE SALES DATA